Friday coffee consumption is 30% lower in the offices analysed by INCAPTO . The company has turned that everyday habit into a public research report and an entry point to its business service for companies.
The finding comes from 7.7 million valid consumption records collected during 2024 and 2025 across 1,568 offices in Spain. INCAPTO published its study summary on July 27, 2026, linking it to a download page that requests a name, company, corporate email address and the type of coffee the business currently uses. The same page presents its professional service and offers a 15-minute meeting.
The sequence connects two activities that are usually described separately: operating a connected service and getting a business to start considering it. Machines generate information for replenishment and billing. An aggregated part of that information supports content about working arrangements, sectors and the business calendar. A reader interested in the report then encounters an offer related to the equipment that made the research possible.
That journey makes the case relevant to business-to-business marketing. The coffee brand enters a conversation that extends beyond choosing a drink, while retaining a specific connection to its product. The report demonstrates what a network of connected coffee machines can observe. Its download page turns interest in those observations into an identified interaction with a company.
A report built from data the service already generates
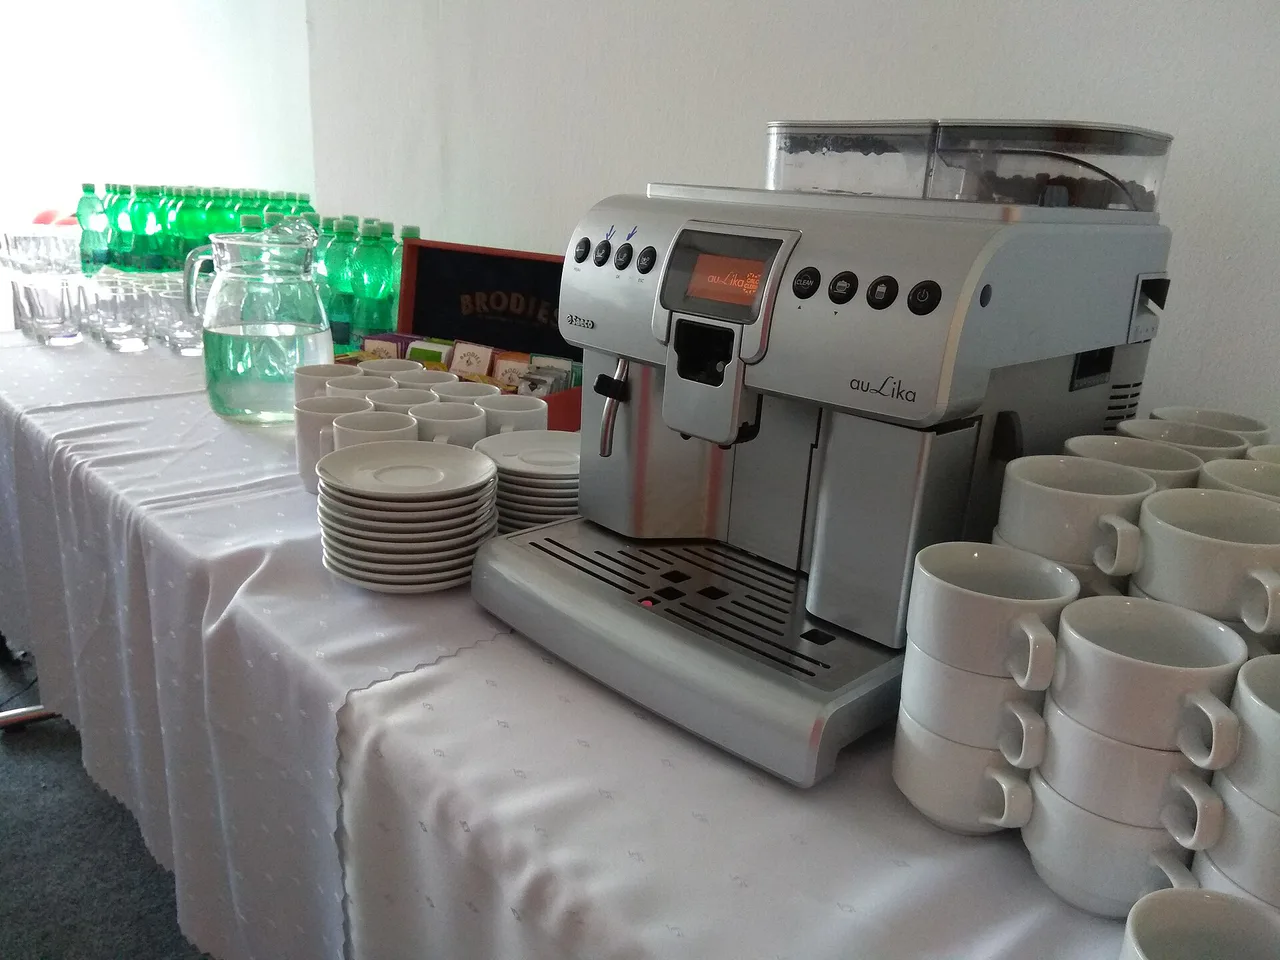
INCAPTO installs and maintains coffee machines for businesses, automatically replenishes coffee beans and bills according to actual consumption. Each cup produces an anonymous, aggregated record used to manage the service. The barometer repurposes that information to examine how office activity changes by day, hour, sector, company size and region.
The study started with 19.5 million raw records. The company says it removed duplicates, synchronisation errors and observations that could not be compared. It retained 7.7 million valid consumption records and normalised the observations per active office and active day. The difference between initial records and analysed consumption belongs to the data preparation process, rather than representing a decline in demand.
That distinction matters to the commercial content. The large number establishes the scale of the research, while the units explain what it represents. An inactive machine or a repeated synchronisation record cannot be counted in the same way as an active office. A brief account of that preparation makes the later findings understandable, from the hybrid Friday to the Christmas shutdown.
The company also compares a stable cohort of 809 offices that were active in both years. Following the same locations through 2024 and 2025 provides another view of the weekly pattern, rather than treating every change as if the composition of the service had remained identical. The report therefore combines a broad sample with a second reading based on offices that can be followed across both years.
Quim Mach , whom INCAPTO identifies as its chief executive and co-founder, explains in the company’s publication that the machines offered a daily picture of activity and that sharing those observations could add something to the remote-work debate. The editorial decision gives a public use to information generated inside the product. Operational data becomes a reason to speak to people who organise or supply an office.
Friday follows different patterns across sectors
The most memorable finding is the Friday decline: 30% against the Monday-to-Thursday pattern. The company observes it in both years. In the stable cohort, Friday consumption averages 18 coffees per office in 2024 and 19 in 2025. The weekly pattern persists even as the mean volume differs between the two years.
The sector breakdown gives that headline more detail. Friday consumption falls by 43% in financial services and in advertising and marketing; by 41% in retail; by 39% in administrative services; and by 38% in programming and IT. The decrease is 13% in construction and 11% in machinery manufacturing.
Friday changes by sector
Decrease in Friday coffee consumption against the Monday-to-Thursday pattern in offices analysed by INCAPTO. The differences describe activity at machines in the sample, with a larger decline in financial services and advertising than in machinery manufacturing.
% decrease
Tap or hover for details. All values are also available in the data table.
Collapse notes
Figures from the report covering 2024 and 2025. Coffee is a proxy for office activity. Leisure and entertainment is excluded: it includes gyms, cinemas and fairs with activity unlike a conventional office.
Explore the data table
| Category | Friday decrease |
|---|---|
| Financial services | 43 % decrease |
| Advertising and marketing | 43 % decrease |
| Retail | 41 % decrease |
| Administrative services | 39 % decrease |
| Programming and IT | 38 % decrease |
| Construction | 13 % decrease |
| Machinery manufacturing | 11 % decrease |
Those differences relate to the type of activity involved. Organising a remote day is a different proposition for an office role than for work tied to production, installations or a physical service location. The coffee machine’s record offers a signal of those routines. The content makes the difference visible through an everyday measure that readers can recognise from their own workplaces.
INCAPTO also reports a 4% decrease in leisure and entertainment, while explaining that this category includes gyms, cinemas and fairs. Activity in those venues can increase on Fridays or at weekends. Placing them beside a financial-services office without that context would make the comparison too simple. The composition of each group is part of what makes the segmentation useful.
For the report’s distribution, the differences provide specific entry points into several professional conversations. A financial-services reader finds a figure about that sector; someone in an industrial business sees a different pattern. That variety comes from observations within the sample and gives one piece of content several relevant readings. The company can maintain a common research asset while allowing each reader to identify the section closest to their own work.
The week changes more than the time of the first coffee
The study finds greater flexibility between days than within the working day. The main consumption peak remains at 9 a.m., and close to half of daily coffee consumption occurs between 8 a.m. and 10 a.m. Another increase appears around 2 p.m. INCAPTO describes the hourly curve as almost identical in 2024 and 2025.
This adds another dimension to the Friday headline. Lower activity at the end of the week can coexist with stable consumption times among those still using the office. The product records both: when a machine is active and when its consumption is concentrated. The report turns them into separate questions for the reader, rather than expecting one number to explain every aspect of working arrangements.
The annual calendar reveals another difference. February averages 27 coffees per office and day, while August averages 18. The company places August consumption between 20% and 25% below the annual mean. These observations describe months with different rhythms, alongside a daily pattern in which the first morning coffee remains a point of concentration.
February and August: the two published extremes
INCAPTO’s public summary places February at the high end of consumption and August at the low end of activity. These are the two published observations, without interpolating a series for the remaining months.
coffees per office/day
Tap or hover for details. All values are also available in the data table.
Collapse notes
Summary of the analysis covering 2024 and 2025. This is not a complete monthly series or a count of workers present. The published figures do not separate each year here.
Explore the data table
| Category | Mean consumption |
|---|---|
| February | 27 coffees per office/day |
| August | 18 coffees per office/day |
The Christmas period produces a more concentrated change. Consumption on December 24 equals 40% of the level in a normal week; December 26 reaches 42%, and December 31 reaches 33%. Those figures describe the activity that remains. Reading 33% as a decrease of 33% would change the finding: the report presents it as the share of normal consumption still recorded on that day.
How much consumption remains on three Christmas dates
Coffee consumption on three Christmas dates as a percentage of the level in a normal week, according to INCAPTO. The bars represent the share that remains, rather than the percentage decrease.
% of normal consumption
Tap or hover for details. All values are also available in the data table.
Collapse notes
The study covers 2024 and 2025. The summary publishes these dates without separating each year here. Figures represent relative consumption rather than the share of employees working.
Explore the data table
| Category | Consumption versus a normal week |
|---|---|
| 24 December | 40 % of normal consumption |
| 26 December | 42 % of normal consumption |
| 31 December | 33 % of normal consumption |
The contrast between August and Christmas gives the barometer a narrative beyond a single weekday. Summer reduces activity across a whole month, while particular dates concentrate the December change. The company organises its observations around experiences familiar to the businesses using its service. The report can be read as an office calendar and as a demonstration of the information generated by a connected supply service.
Geography and company size depend on what each machine serves
The Valencian Community has the highest average among the four regions highlighted in the public summary: 19 coffees per office and day. The Basque Country and Madrid record 18, while Catalonia records 12. The difference is visible, but the report explains that the samples contain businesses of different sizes and profiles.
The Catalan sample includes 487 offices, compared with 173 in Madrid. Smaller businesses and self-employed professionals have a greater presence in the former. The regional figures therefore describe mean consumption at the offices observed in each location. They can be compared as samples, provided their composition travels with the numbers, rather than becoming a direct ranking of employee attendance.
Regional averages come from different samples
Mean consumption per office and day in the four regions highlighted in the public summary. Interpretation depends on the size and type of office in each sample, so this comparison shows recorded consumption rather than a ranking of office attendance.
coffees per office/day
Tap or hover for details. All values are also available in the data table.
Collapse notes
The Catalan sample contains 487 offices, compared with 173 in Madrid, with different representation of small businesses and self-employed users. A uniform office-size breakdown for every region is not supplied here.
Explore the data table
| Category | Mean consumption |
|---|---|
| Valencian Community | 19 coffees per office/day |
| Basque Country | 18 coffees per office/day |
| Madrid | 18 coffees per office/day |
| Catalonia | 12 coffees per office/day |
Company size creates a similar interpretive issue. Offices belonging to businesses with fewer than 10 employees serve an average of 10 coffees daily; those at businesses with more than 500 employees reach 44. A machine in a large organisation may supply only one floor or department, whereas another serves a whole small company. Total company headcount and the population served by an individual machine are different denominators.
That detail matters particularly to this marketing case. The commercial service operates through machines installed at specific locations, and the report retains that same unit of observation. The explanation connects the findings to the way the product works: consumption at service points, organised to answer questions about business activity. The content’s usefulness depends on keeping the connection between the data, the location and the service visible.
A download that asks about the company’s current coffee
The landing page structures the research as a publication with several layers. It presents 24 months of data, announces seven findings and previews four, while reserving the remaining findings, sector and regional rankings and the full method for the PDF. Visitors can understand the subject before sharing contact details and retain a specific reason to request the complete document. Delivery by email belongs to the way the research is distributed, alongside the public summary that supplies the first set of observations.
The form appears twice: near the initial download proposition and again after the findings and method have been introduced. That repetition accommodates different reading paths. A visitor already interested in the report can request it near the top; someone evaluating the material encounters another opportunity after reading the supporting content. Both forms keep the same connection to the business, asking for an organisation’s identity and its existing coffee arrangement, rather than merely requesting an email address without context.
The report’s landing page carries the conversation into a form designed around a professional reader. Alongside a name and corporate email address, it requests the company and its current coffee type: capsules, beans, vending, filter, instant coffee, no coffee or another option. The report is offered by email, with consent for relevant communications from INCAPTO.
Asking about the current coffee arrangement relates directly to the offer. Two readers interested in remote work can belong to businesses with different supply systems. Collecting that answer preserves information about the organisation’s starting point. The editorial asset and the form are connected by a need the supplier already addresses: how coffee is provided inside a business.
The corporate email places the relationship in a business setting. Company identity and coffee type add context to the contact, while delivery of the report provides an immediate reason to share those details. Each performs a different function within the journey. The reader does not have to state an intention to purchase before the conversation begins, because the proposed first exchange concerns a specific piece of research.
The same page then presents the offer under INCAPTO Professional. It introduces the machine, maintenance and subscription, and connects to a 15-minute meeting reservation through HubSpot . The journey can move from a broad question about workplace routines to a discussion about a particular coffee service. A stated meeting length and a booking link make the available commercial next step visible.
Marketing technology has an observable role in distribution, alongside the technology installed in the machines. The report uses a HubSpot-built landing page and a meeting call to action within the same acquisition setting. The form collects professional information related to the service; the content supplies a reason to begin the relationship.
The value proposition is also visible in what the brand can report
The research provides a product demonstration beyond a list of features. Building the barometer requires information generated by connected coffee machines and a service operating across many offices. Publishing aggregated findings shows one consequence of that infrastructure: the company can observe consumption patterns at locations and follow them over time.
The demonstration sits inside a subject relevant to businesses planning their use of offices or reviewing workplace services. The connection does not rely on inserting a promotion into every section of the study. Findings about Fridays, holiday periods and daily peaks carry the narrative; the download page places beside them an opportunity to learn about the service that produced the information.
The final proposition adds a second use to the workplace coffee service. The page presents the machine as a workplace analytics tool and connects consumption patterns to facilities decisions, meaning the management of services and installations at a workplace. This is how INCAPTO positions the technology commercially. In the public report, the observed measure remains coffee consumption recorded at the machines, accompanied by the coverage differences the company itself describes. The distinction keeps the research finding understandable while showing the wider business proposition built around it.
The INCAPTO Professional section pairs that argument with the existing service: freshly ground speciality coffee, a machine, maintenance and a coffee subscription. For a reader whose business uses capsules, it presents another supply arrangement; for someone drawn in by the barometer, it adds a view of office activity. The form’s question about the current coffee type connects to the first conversation, while the research results introduce the second. Both propositions are available on the same page before a visitor reaches the meeting reservation, giving the report a specific role within the service presentation.
The case therefore joins a connected product, original analysis and an identified route to contact. Each contributes something different. The machine generates a record; the report selects and explains patterns; the landing page organises content delivery and makes a commercial conversation available. The journey is understandable because all three belong to the same setting: an office that consumes coffee and decides how to obtain it.
The barometer’s precision also belongs to that proposition. One cup does not automatically equal one person present, and one machine does not always represent an entire business. INCAPTO presents consumption as a signal of activity and explains the differences. In a story built around the product’s own data, preserving that unit lets the research and the commercial demonstration retain a common meaning.
Who's who and how to read the figures
INCAPTO is the brand of COFFEE IS INCAPTO S.L., a company registered in Barcelona’s commercial registry with tax identifier B67609404. INCAPTO Professional is the business offer presented alongside the report download. The company’s publication identifies Quim Mach as its chief executive and co-founder.
The 7.7 million observations are valid coffee-consumption records, rather than different people. The 1,568 offices form the general sample; the 809 in the stable cohort were active during both analysed years. Normalising per active office and active day makes it possible to express averages for service points within the analysis.
Friday’s 30% figure is a decrease against the Monday-to-Thursday pattern. The Christmas percentages instead express how much normal consumption remains. The observations cover 2024 and 2025, while the public summary appeared in July 2026. The report’s release date and the period measured perform different functions in this account of how the company uses its information.
In this article

Marian Vasile
Marian Vasile is a MarTech and growth professional. His work spans product marketing, SEO, paid advertising and deep online tracking, including behavioral analytics and attribution.